How to spot the gap between reported percent complete and the site
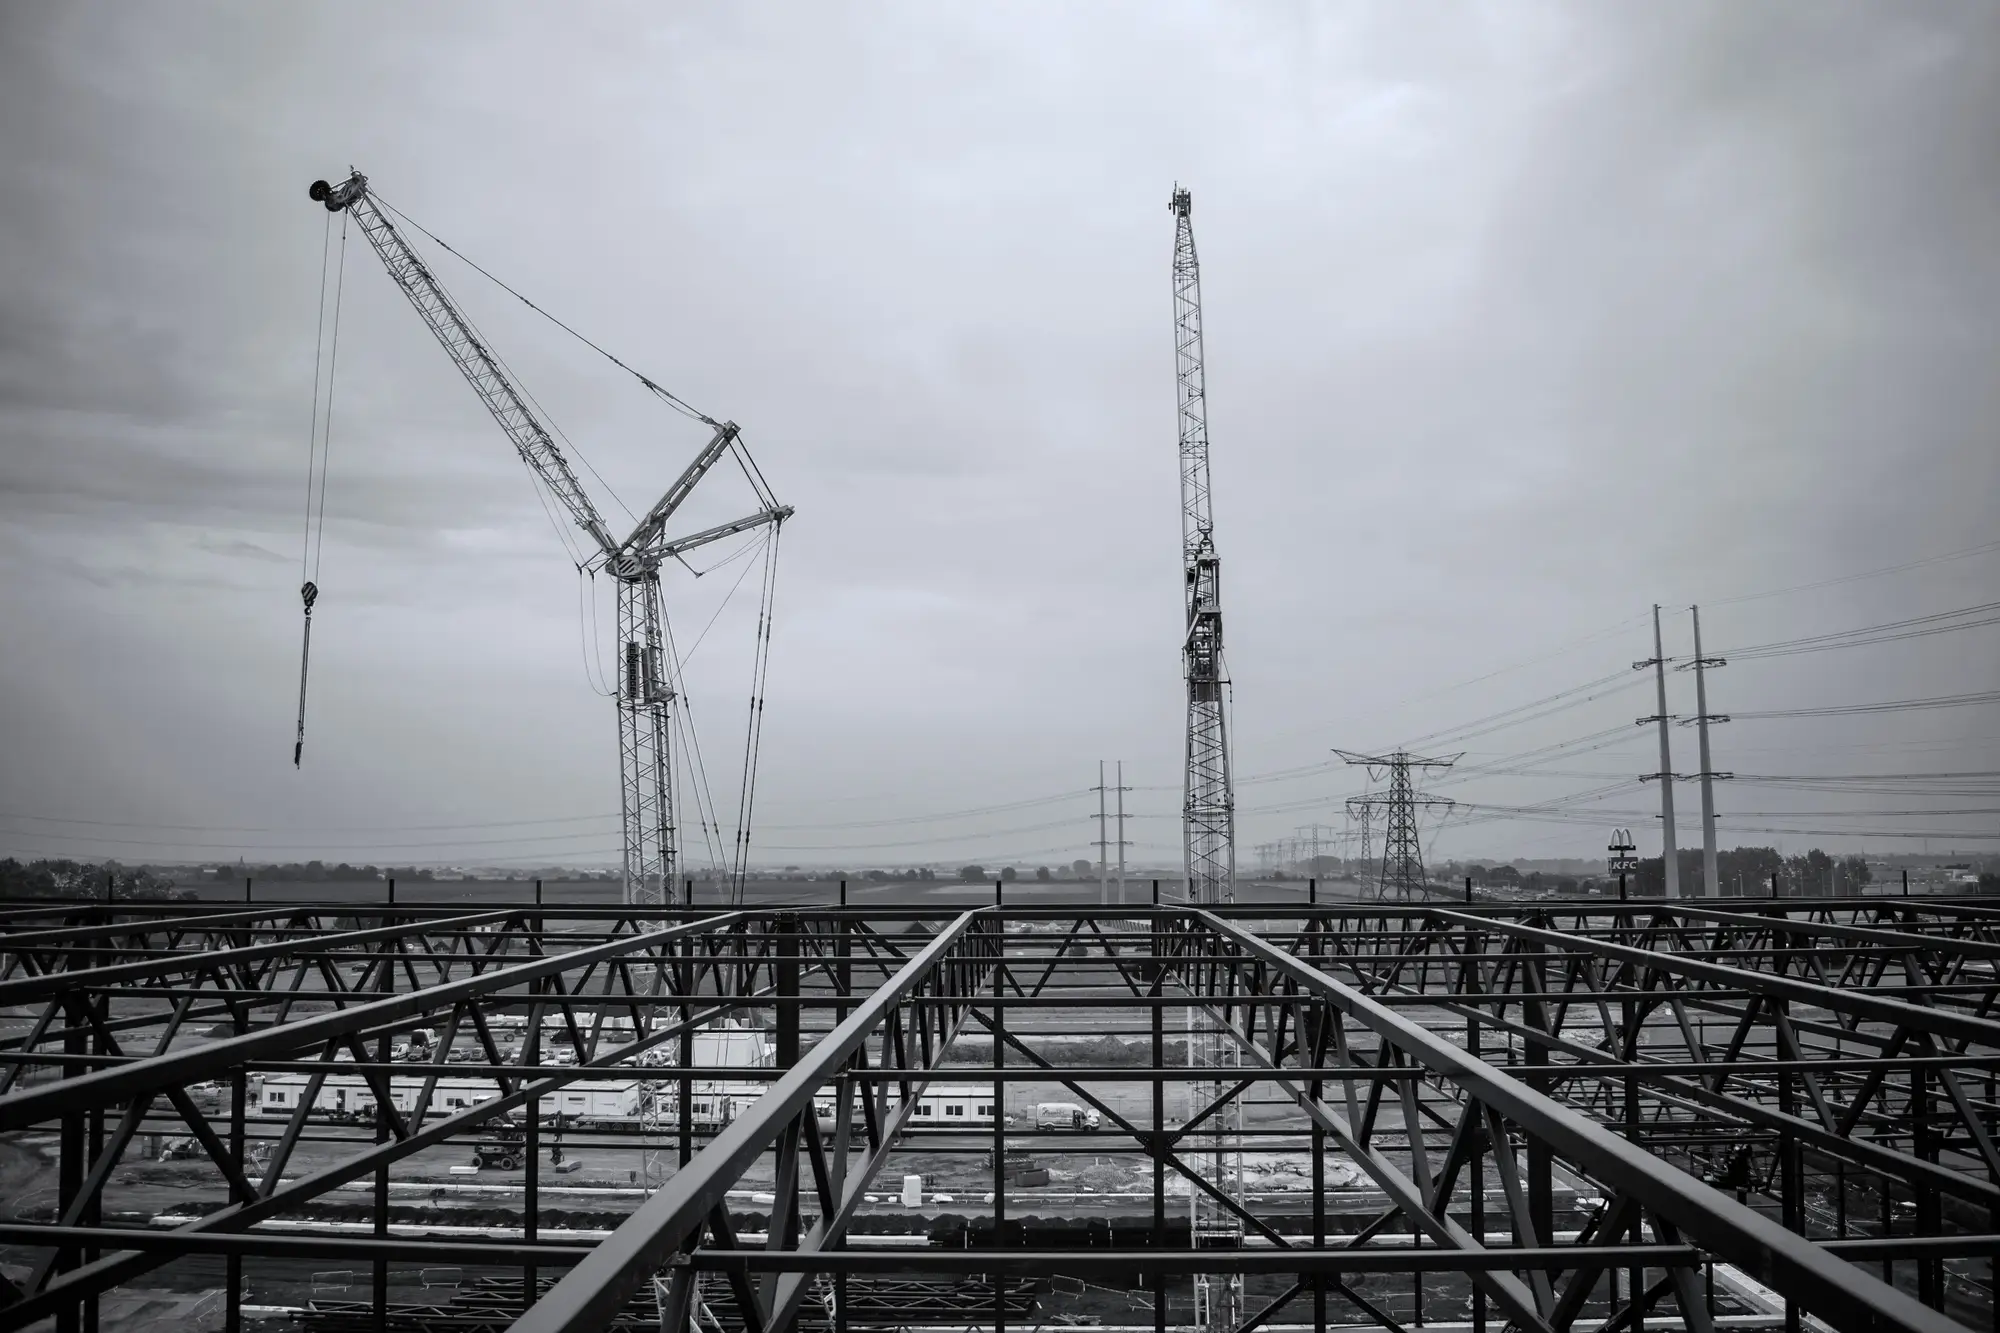
Every monthly report has the same number near the top: percent complete. 61%, 68%, 74%, climbing in a nice clean line toward mechanical completion. That number comes from an earned-value calculation: weighted milestones, engineering hours burned, procurement commitments, and installed quantities, rolled up by the contractor who also owns the schedule it gets measured against. The number is honest accounting. It just measures a different thing than how much of the plant is standing today.
The gap shows up because percent complete and physical progress measure different buckets. A module that's 90% fabricated at a yard in Korea or the Gulf Coast carries real earned-value credit before it ever leaves the dock. Engineering percent complete can hit the high 90s while civil work on site is still pouring foundations. Procurement spend counts toward the curve the day a purchase order is issued, long before the equipment shows up on a flatbed. All of that is standard accounting practice. None of it tells a lender or a trader whether steel, piping, and tie-ins are going into the ground at the rate the schedule assumes.
Where the numbers quietly diverge
A few patterns show up often enough to be worth watching for specifically:
- A flat or slow-growing S-curve that suddenly steepens. Contractors sometimes hold conservative progress early and "true up" later, which can mask a real slip until it's close to unrecoverable.
- Procurement-heavy progress with no corresponding site activity. If percent complete is climbing on committed purchase orders and fabricated modules sitting in a yard, but the last site photo shows the same open lay-down area it showed three months ago, the curve is ahead of the ground.
- Milestone weighting that shifts between reports. A revised progress measurement baseline, often buried in a footnote, can produce a jump in percent complete that has nothing to do with new work performed.
- Mechanical completion claims that outrun punch list reality. Systems get called complete for turnover purposes while instrumentation, insulation, or painting are still outstanding. That's standard practice, but it reads very differently to someone modeling a startup date than to the construction manager closing out a subsystem.
None of these are necessarily red flags on their own. Earned-value schedules are built this way on every large project, and a good project controls team can walk you through every line. The issue is that as a trader, lender, or counterparty EPC watching from outside the fence, you usually don't get that walkthrough. You get the summary number and a narrative paragraph, on the contractor's timeline, filtered through the contractor's incentive to keep the curve looking healthy against the financing or offtake milestones tied to it.
What an outside read checks
A useful check compares the reported curve against something the project office doesn't produce: what's physically on the ground, month over month. Most counterparties don't have the access or the controls-engineering staff to audit the earned-value methodology itself, and don't need to for this purpose.
Module count in the lay-down yard. Pipe rack steel erected versus planned. Tank shell courses going up. Flare structure height. Whether the footprint that was supposed to be under roof by Q3 has a roof.
That's the gap Refinery Progress is built to close. It tracks module placement and structure growth from monthly very-high-resolution imagery and change detection, so you get a physical progress read that sits alongside the contractor's reported percent complete instead of replacing it. When the two agree, that's useful confirmation. When they don't, that's the conversation worth having before the next drawdown or hedge decision, not after.
If your financing or trading position is riding on a startup date that someone else is reporting progress against, it's worth seeing what the site shows on its own terms.